The Debug Panel provides quick access to a variety of statistics and profiling tools to test in your scene
- Toggle in-game FPS display
- Toggle in-game GPU stats display
- Toggle in-game Tick stats display
- Toggle in-game unit graph display
- Profile GPU Visualization at the current tick
- Toggle Visibility Stats
- Toggle RHI Stats
- Switch between different in-editor view modes
- Launches Issue Report Widget
- Debug log window
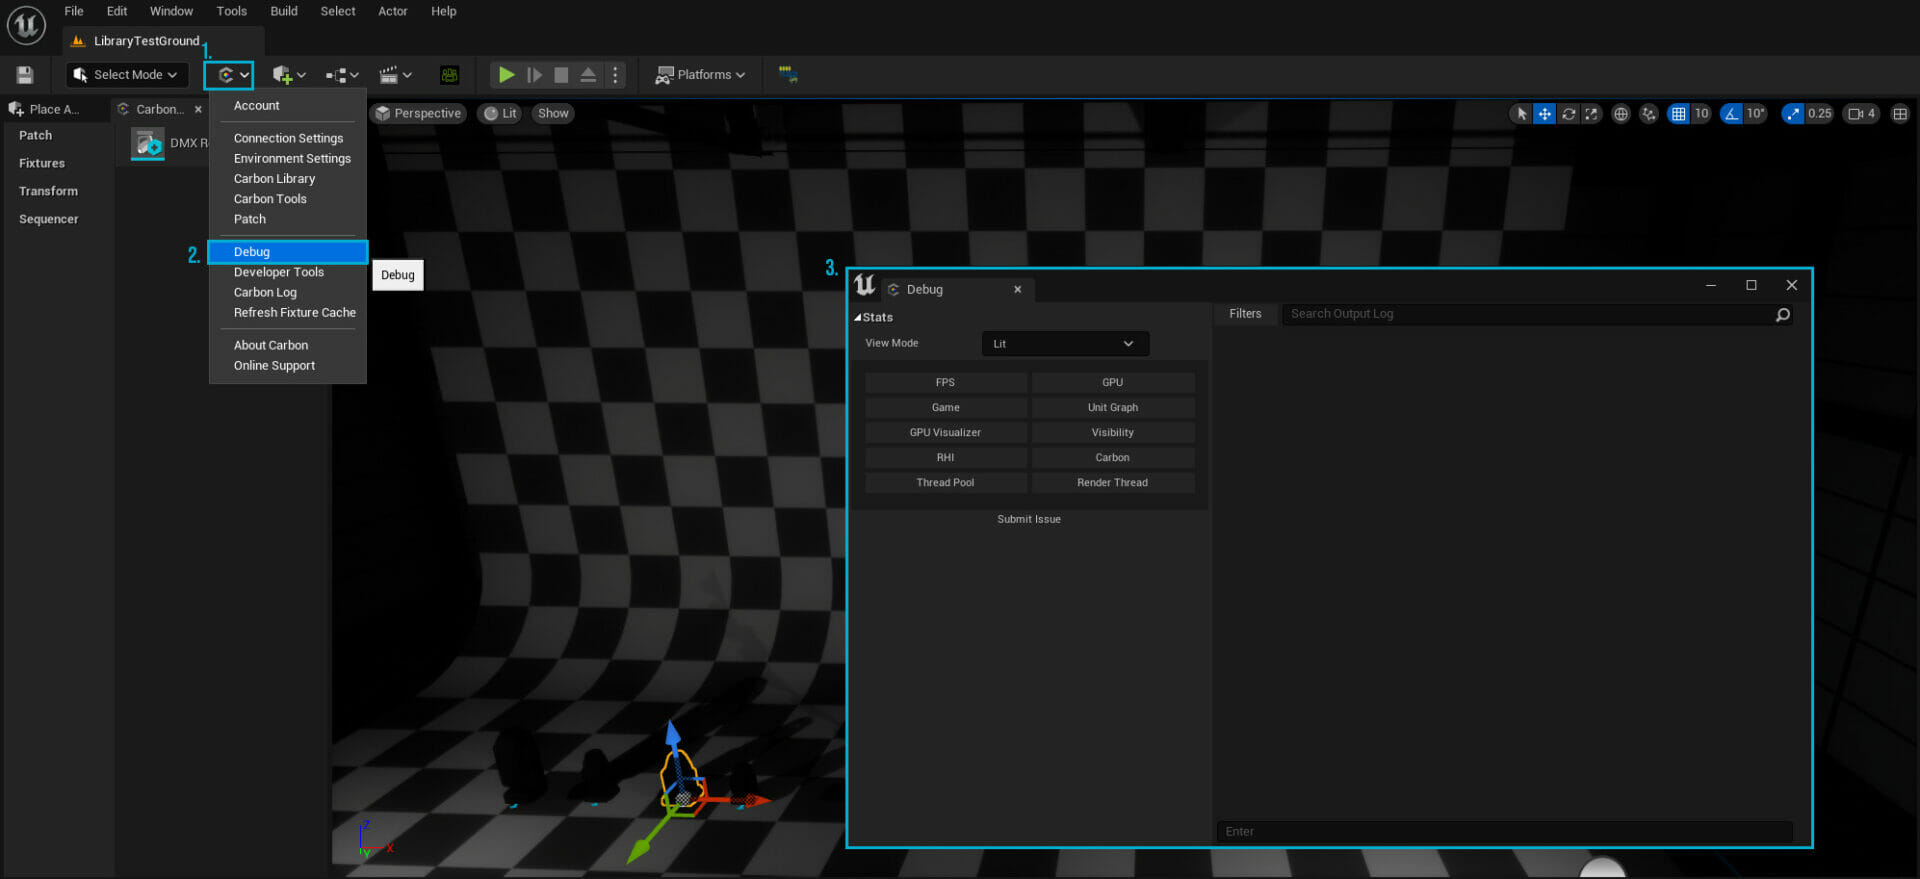
(The Debug Panel provides tools to monitor and troubleshoot the performance of the visualization)
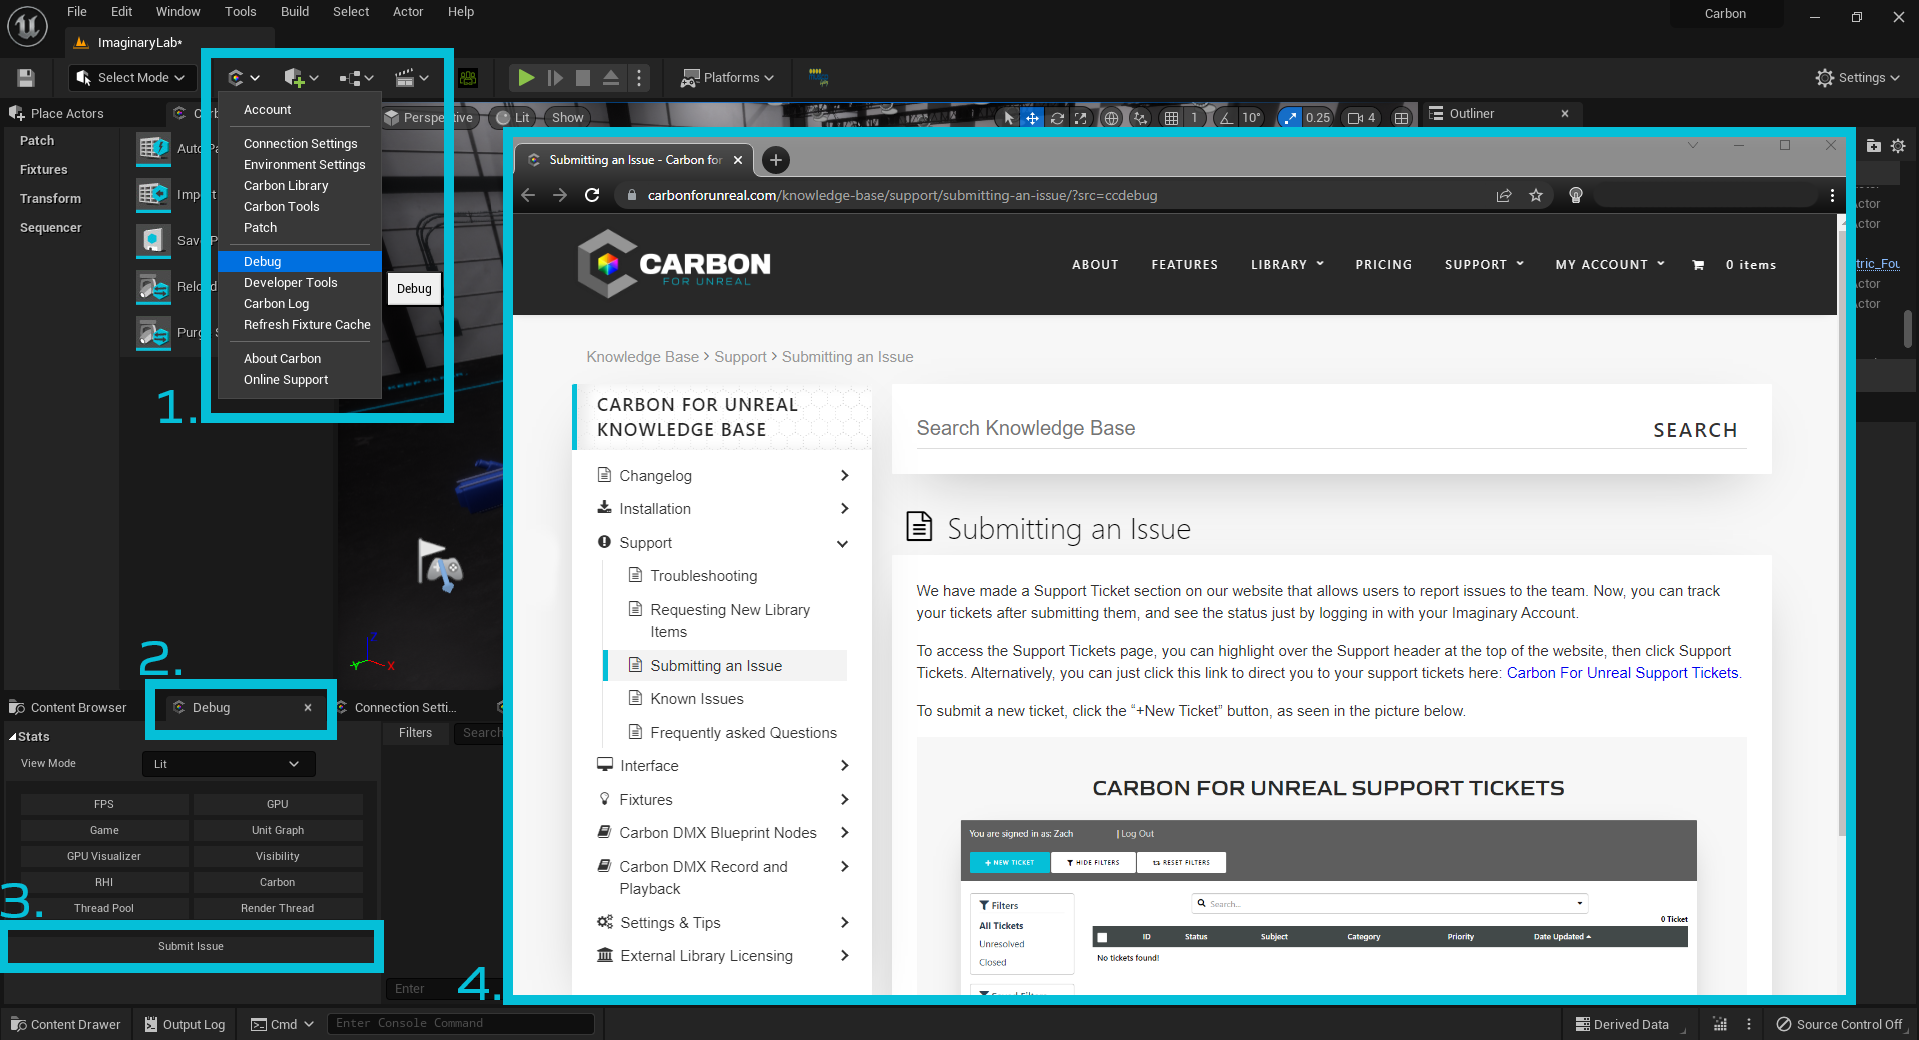
Submitting a Ticket
Carbon offers easy support access with the “Submit Issues” button that allows you to submit tickets to our developers. To do so, you may right click on any fixture in the library tab, and select- Submit Issue. Additionally, there is a button on the bottom of the Debug Panel. Both currently function the same. You will be directed to the CARBON FOR UNREAL KNOWLEDGE BASE under the “Submitting an Issue” page. Click here to go to that page: Submitting an Issue.